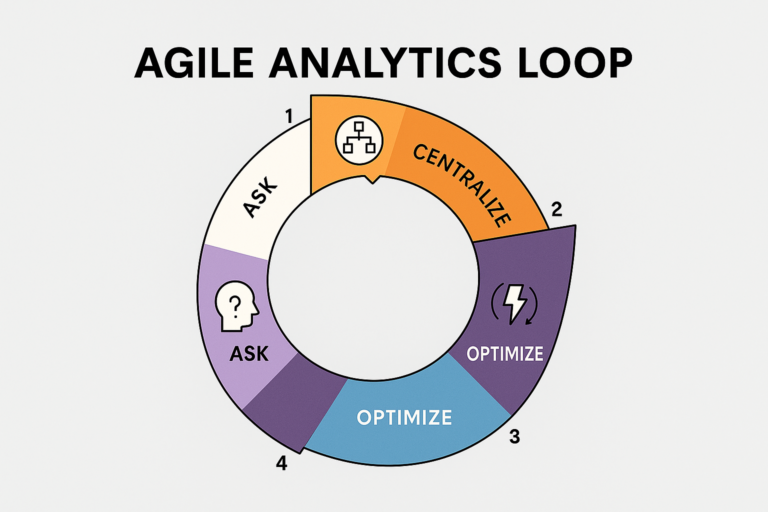
As shared in the previous article about Agile Analytics, marketers can start their data analysis journey with just one question and follow a simple 5-step loop:
Ask, Centralize, Analyze, Optimize, Iterate.
In the early stages, data volume and analysis models tend to be simple. However, with each iteration cycle, the amount of data to connect and analyze grows in complexity. At that point, marketers need to restructure their analytics system through two key tools: Dashboard and Report, to reduce manual work while increasing the effectiveness of analysis and decision-making.
So how do you combine these two tools as a mutually supportive combo, while avoiding common mistakes? Let’s dive into the details with “From Insights To Impacts.”
1. Distinguishing Dashboard and Report
While both are analytical tools that support campaign management and marketing optimization, Dashboard and Report have fundamentally different characteristics and purposes:
Dashboard is for quick monitoring, instant updates:
- Objective: Give you a quick, up-to-date view of actual results versus targets.
- Common dimensions: By time, by SKU/product, by channel, by customer segment, by salesperson…
- Expected outcome: Quickly spot changes, anomalies, or notable patterns. Then respond promptly or formulate questions for deeper analysis.
- Frequency: Regular. Could be daily, weekly, or even hourly depending on campaign specifics.
Report is for deep analysis, understanding root causes and insights:
- Objective: Analyze in detail to explain why changes occurred, find root causes, discover insights, or draw lessons for the next campaign.
- Common dimensions: Same as Dashboard but can be expanded further.
- Expected outcome: Clarify root causes, identify success factors, or propose strategies to improve performance.
- Frequency: Weekly, monthly, quarterly, annually, or triggered when the dashboard detects anomalies needing deeper analysis.
2. A Dashboard is a control panel, not a chart warehouse
One of the easiest mistakes marketers make when they start using visualization tools is greediness, cramming every piece of information into the Dashboard because every number seems necessary. The result is a cluttered dashboard where viewers lose direction and struggle to make decisions.
In marketing, dozens of metrics are used daily: Impression, Reach, Click, CTR, CPC, CPM, Conversion rate, ROAS, CAC, GMV, Time on site, Bounce rate, Add to cart, Purchase rate, etc.
If you put everything on a dashboard without structure or goal-based categorization, viewers won’t know where to focus. They’ll spend time “scanning each metric” without finding the key point or spotting trends and anomalies worth investigating.
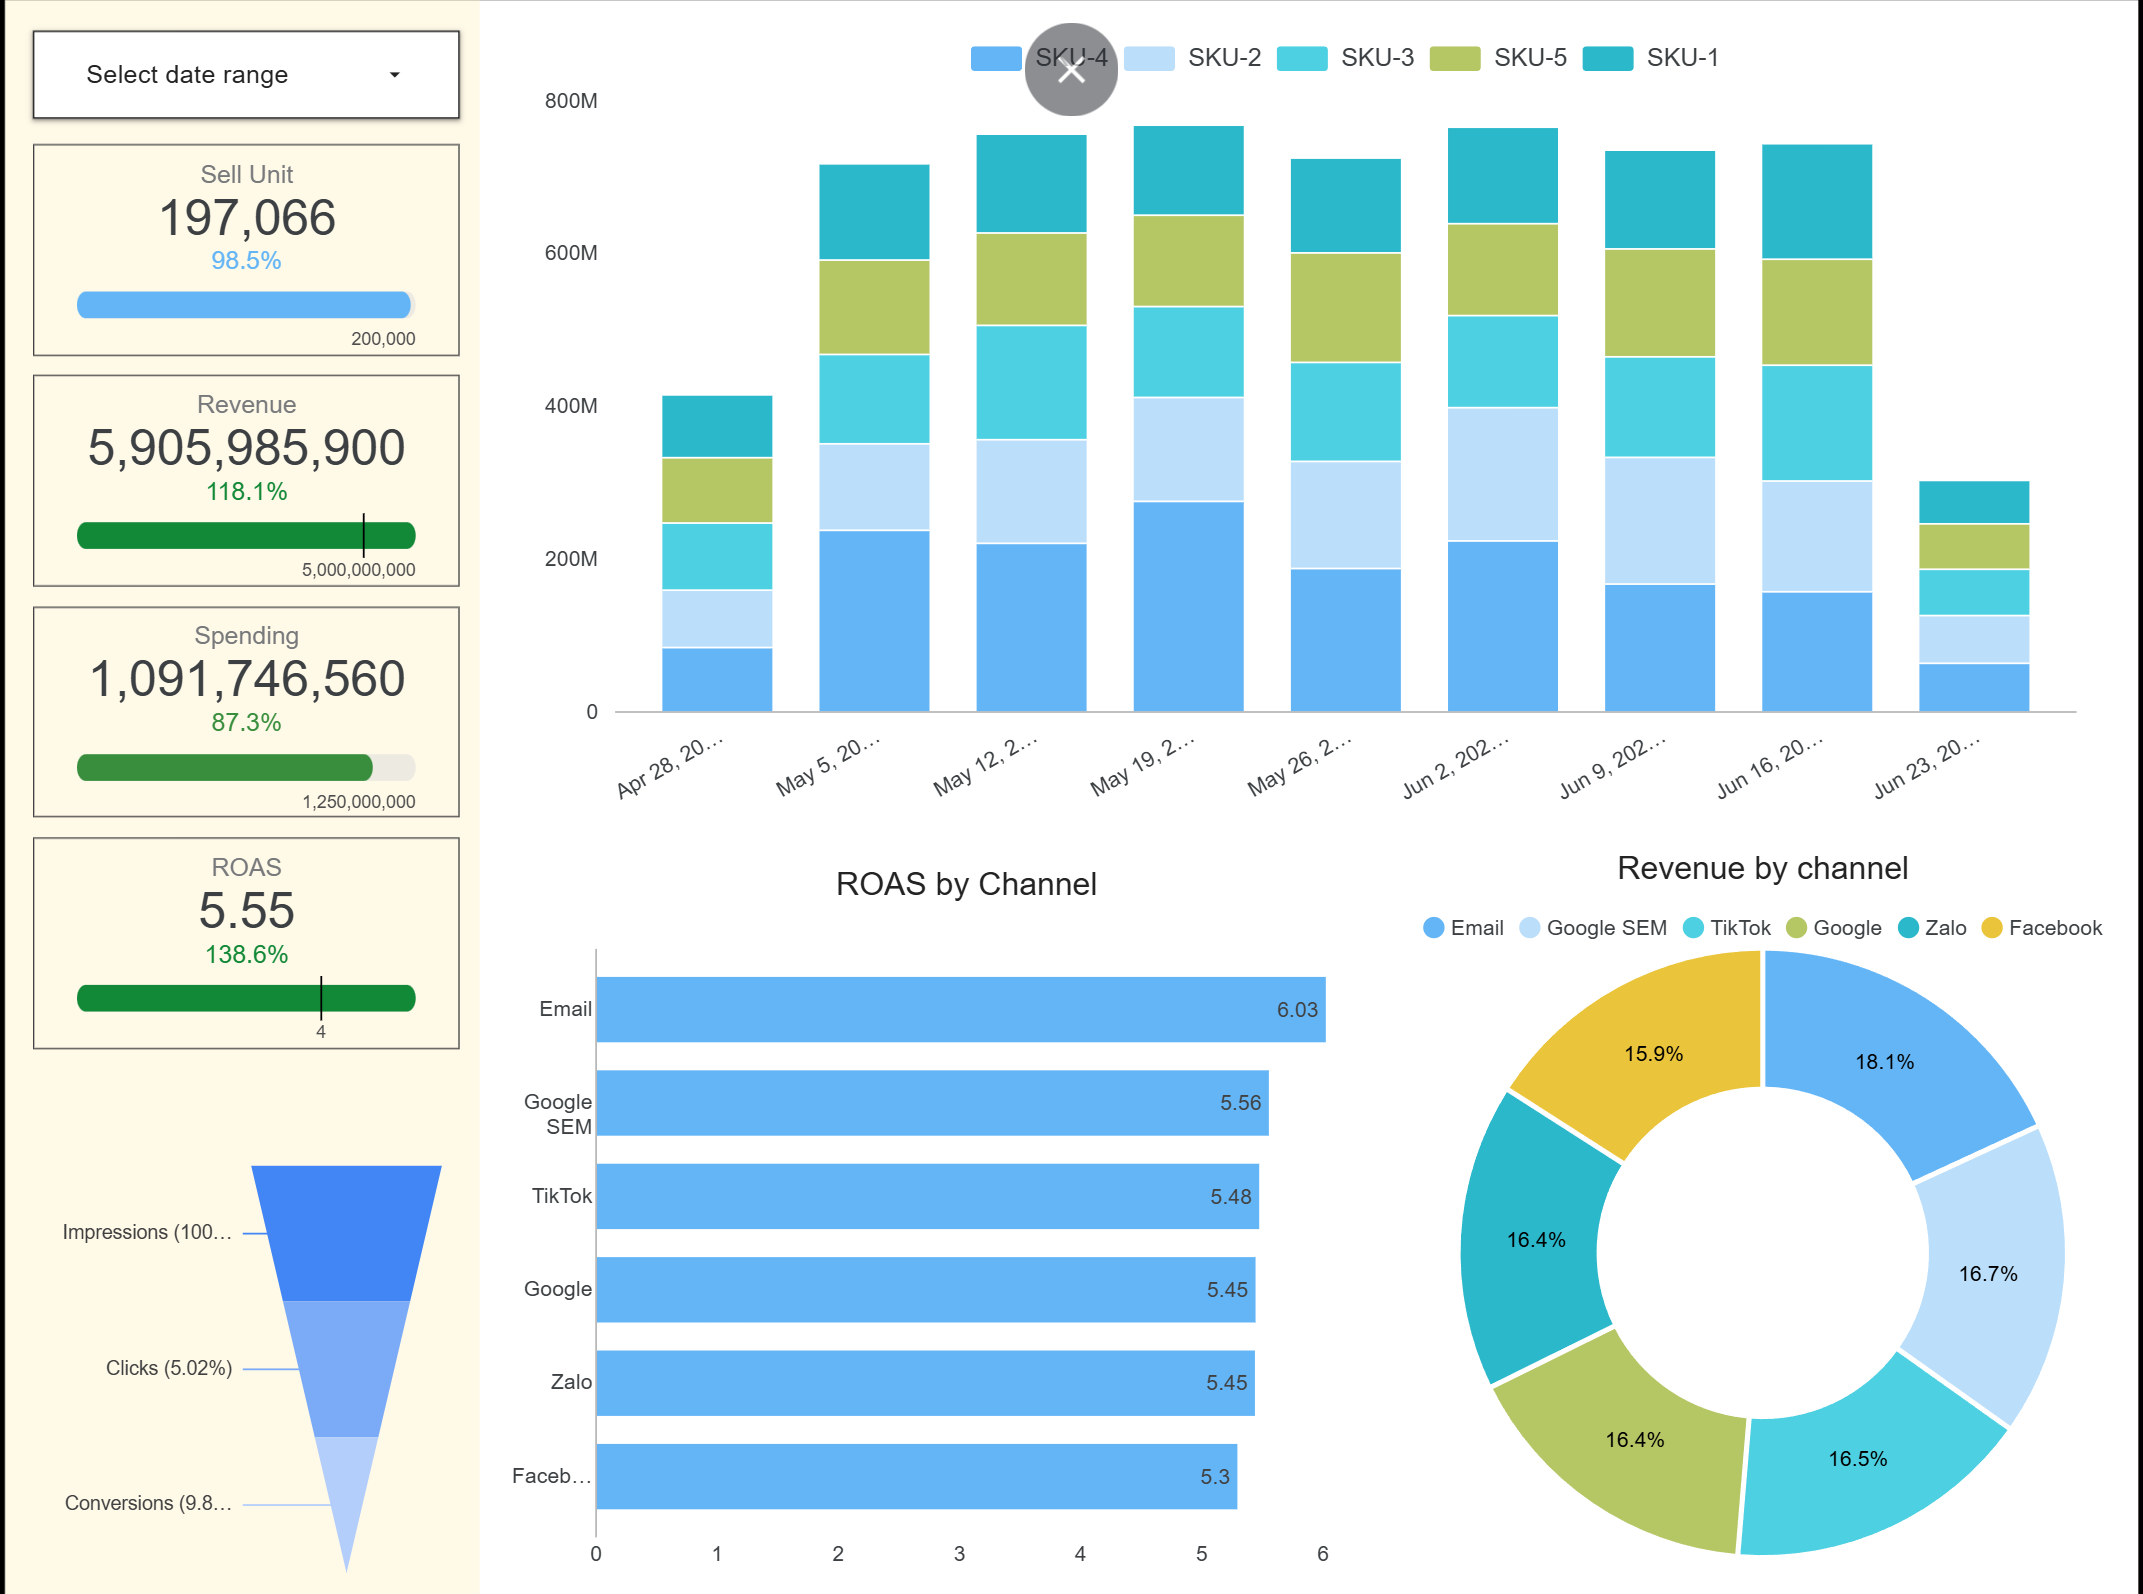
Instead, design your dashboard following a campaign management and optimization thought flow from overview to detail:
- Top-level overview: 5 to 7 core KPIs to evaluate campaign progress
- Funnel view: Track performance at each stage from impression to conversion
- Deep-dive details: Tabs with breakdowns by SKU, channel, customer segment, time, for filtering when deeper analysis is needed
These dashboard views are based on sample data generated by computer for illustration purposes, not actual dashboards or standard templates to apply.
3. Reports also need automation and connection back to dashboards
With a “each report is one-off” mindset, many marketers still create reports manually, preventing readers from interacting with or tracing back to the data. Or valuable analysis within reports isn’t reused, never feeding back into the dashboard system to create a continuous optimization process.
The solution is simple:
- When creating reports, identify and save valuable analyses or recurring patterns for future cycles
- Save the analysis logic as supplementary views in the dashboard, or create an interactive, auto-updating report version
This way, if you encounter a similar pattern next week, you just need to filter a few parameters instead of repeating the entire manual process.
4. Flexibly combining Dashboard and Report: What do you need to prepare?
For these two tools to truly support you and your marketing team, start with three core capabilities:
(1) Understanding metrics and analytical thinking:
- Correctly identify KPIs and early-warning indicators (Leading indicators)
- Recognize when to use a dashboard for monitoring versus a report for deep-diving
(2) Centralized and standardized data:
- Store data in a centralized system. I recommend professional data warehouses for security, scalability, and easy access
- Standardize naming conventions and formats: SKUs, channels, campaigns…
(3) Data processing and automation skills:
- Proficiency in basic SQL, Python or equivalent tools for data extraction, processing, and building analysis models
- Ability to use Looker Studio, Power BI, or Tableau for data visualization
- Create periodic workflows to keep the system running continuously with fresh data and minimal manual effort
5. Summary
Dashboard helps you monitor and detect issues and opportunities early. Report helps you dig deeper and make more accurate decisions. Both need to be combined and automated so you save time, learn from data, and act more systematically.