The other day I had a conversation with some friends about how to use data in marketing and where to start. “Should I learn Data Analytics?”, “Learn Power BI?”, “Learn Looker?”
I asked them what data they currently had and how they were using it. Most of them had Google Analytics and used it similarly: they could read and analyze traffic, bounce rates, sources, engagement, conversions… the basics. However, they all shared that doing deeper analysis required downloading and processing data that was too time-consuming, making it hard to repeat daily.
So if your boss suddenly asks: “How does landing page A compare to landing page B? What about year-over-year?” you’d need to spend hours digging through data to answer the “What” before you could even get to the “Why.”
From my practical experience in marketing data analysis, I recommend starting with the data source you already have and know well, like Google Analytics (GA4). This helps you identify your current skill level and plan how to improve your skill set to reach the highest level. As you progress, your data processing foundation and analytical thinking will grow too, and you can apply these skills to other datasets.
Upgrading your data analysis skills doesn’t just help you answer your boss’s questions faster. It opens up opportunities to make better decisions, optimize campaign effectiveness, and clearly increase profitability.
Below, I’ve categorized the skill levels of data analysis with GA4 for your self-assessment and upgrade planning:
LEVEL 1: “VIEWING” (Basic Data Reading)
At this level, marketers primarily use GA4’s default interface to view basic metrics:
- Sessions, users, traffic sources
- Events, conversions
- Funnel and path reports in the Explore section
Google has also integrated some AI to suggest notable insights, saving you search time.
Case Study 1:
Thao works as a content creator for a dental website. Each week, she checks GA for traffic by blog post, measuring content effectiveness from organic/social channels. When she spots a post with a high bounce rate, she knows the CTA or internal linking needs improvement.
Limitations:
- Pre-built dashboards limit perspective and lack flexibility.
- Time-consuming when you want deep insight analysis; hard to quickly compare different periods or sources.
- Cannot combine with external data like CRM or ad spend for a holistic business performance view.
Skills needed for Level 1:
- How to use GA4’s Explore section.
- Understanding GA4 metrics and their meanings.
- Developing analytical thinking about insights, not just “viewing metrics” but asking “why” and “how.”
LEVEL 2: “EXPLORING” (Self-Service Data Freedom)
You’ve learned to use Looker Studio, Power BI, or Tableau to:
- Centralize reports in one place for easier performance management and reporting, especially if your business has multiple websites or apps.
- Create automated dashboards with near-time to real-time updates, saving massive amounts of manual reporting time.
- Blend multiple data sources like Google Ads, Facebook Ads, CRM, gaining a broader view of the customer journey and multi-channel effectiveness.
Case Study 2:
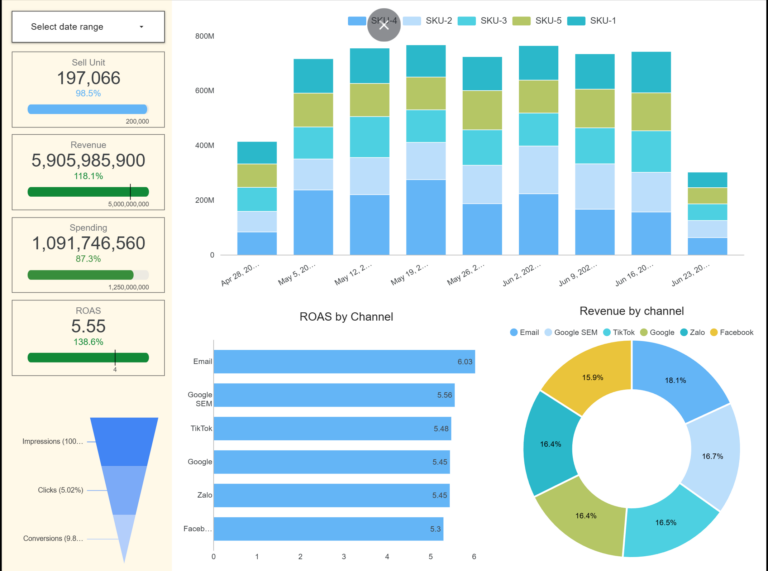
Dung, a marketing leader in the fitness industry, used Looker Studio to create a dashboard showing landing page performance across multiple channels (Google Ads, Facebook, TikTok, Zalo, email, CRM…). The dashboard saved the team 10 hours of reporting per month. Meanwhile, he noticed 1,000 signups (leads) but only 80 converted customers. The conversion bottleneck was at the sales consultation stage. Most marketing leaders would shift to improving sales. However, he checked additional dimensions: device type (phone/desktop), traffic source (Facebook ads, Google Search, email), user geography, combined with CRM conversion data. Dung discovered that mobile leads were higher than desktop, but TikTok brought high lead volume with very low conversion rates, while Zalo’s conversion rate was double TikTok’s. This insight helped him quickly adjust budget allocation strategy and optimize conversion effectiveness.
Limitations:
- Direct GA connection to visualization tools doesn’t automatically save historical snapshots, making it difficult to analyze long-term trends or work with large historical datasets.
- Difficult to analyze custom periods or handle extremely large datasets.
- Can’t perform “deep queries” or write advanced analysis logic.
Skills needed for Level 2:
- How to connect GA4 to visualization tools like Power BI, Looker Studio.
- Basic visualization tool operations: chart design, data blending, data control…
- Advanced analytical thinking and data storytelling, turning dry numbers into meaningful business narratives.
LEVEL 3: “MASTERY” (Advanced Data Analysis)
At this level, you:
- Connect GA4 with BigQuery, turning data into daily backups
- Write SQL to query data flexibly (combining CRM, e-commerce, advertising…)
- Process and clean data directly in the warehouse
- Push processed data back to Looker Studio/Power BI for visualization
You can solve virtually any marketing data analysis challenge.
Case Study 3:
>
Linh, growth lead at a beauty booking app.
She combined GA4, marketing cost data, CRM, and e-commerce orders to build a channel-based budget allocation model.
With the insight: “Facebook customers have 25% higher LTV (Lifetime Value) but lower cost,” she reallocated the budget, achieving a 40% ROAS increase after 2 months.
Why I recommend BigQuery:
- BigQuery is free for 10TB/month
- Looker Studio’s free version is sufficient
- Gemini integrated in BigQuery helps you write SQL faster
Skills needed for Level 3:
- Basic SQL (SELECT, JOIN, GROUP BY…)
- Marketing data architecture
- How to plan ETL (Extract, Transform, Load) and build a basic Data Warehouse for marketers
- Advanced analytical thinking with models: cohort analysis, CLV, RFM…
As a marketer without a coding background, I also started from just viewing simple reports. But through continuously upgrading skills and practicing, I’ve “evolved” to Level 3, and you can too!
Subscribe to the free “From Insights To Impacts” newsletter every Thursday!